
Customization
Through nearly 40 years of contact with countless skippers and fisheries research institutes all around the world, we learned that one size rarely fits all.
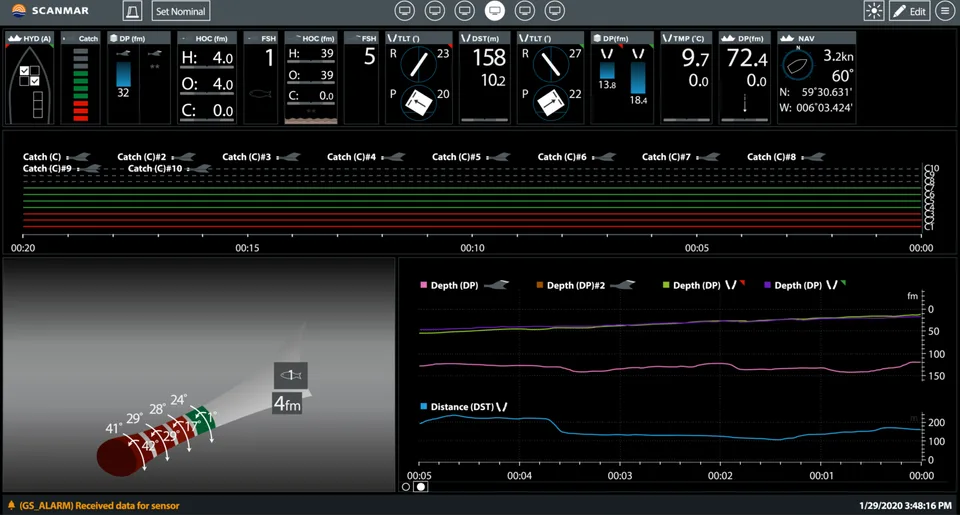
The sensor data one wants to prioritize varies with personal preference, and can greatly depend on the trawling style and the environmental challenges of each fishing area. For this reason, one of the main goals with ScanBas 365 was to give the skipper the flexibility to easily modify his own interface.
The user is given complete control, and can put any sensor data on up to 6 different monitors, scaled to any size. This gives the option of screens with lots of details in one window, or just one parameter featured.
The configuration possibilities are endless and can be modified at any time and saved to a specific profile. With the drag and drop builder, it couldn’t be simpler and more intuitive to modify your setup.
Spider graph
The new spider graph feature is one that skippers are likely to quickly become dependent on.
Even the most seasoned skipper can be overwhelmed by keeping track of multiple sets of sensor data while monitoring all the other practical aspects of the haul. The spider graph simplifies the overview of crucial data, displaying it in a way that quickly shows the parameters with deviations outside the set tolerances. It is essentially a customizable cruise control feature.